Brent
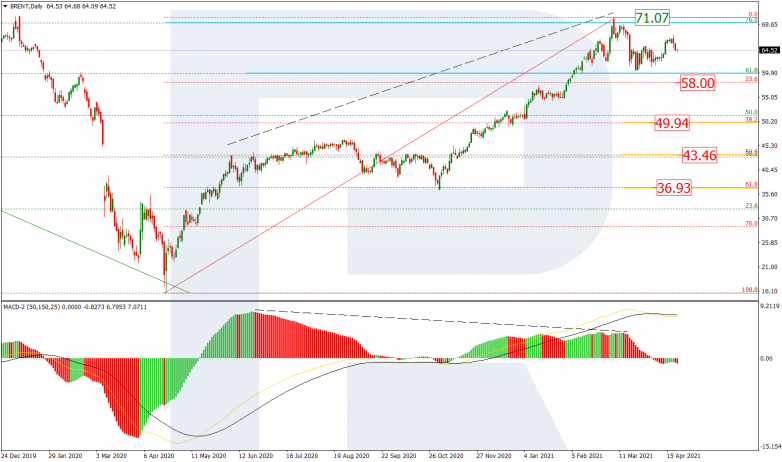
In the daily chart, after failing to reach the high, Brent is trading between the high and 23.6% fibo at 71.07 and 58.00 respectively, and may start a new decline soon. In this case, the price may reach not only 23.6% fibo at 58.00, but also 38.2%, 50.0%, and 61.8% fibo at 49.94, 43.46, and 36.93 respectively. on the other hand, a breakout of the high will result in a further uptrend towards the fractal high at 87.09.


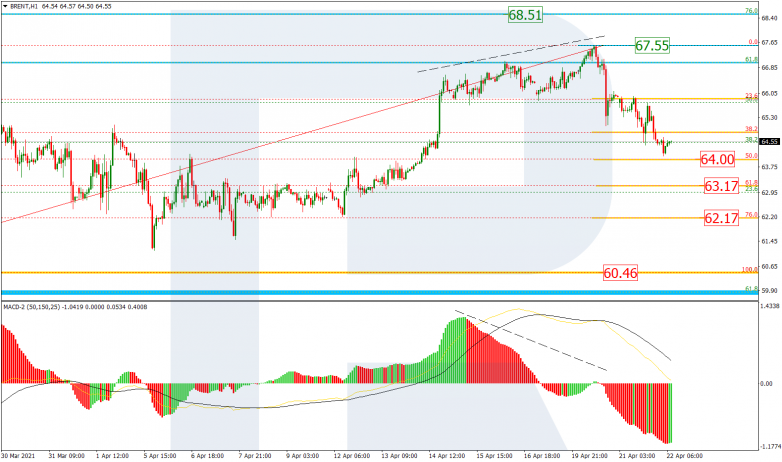
The H1 chart shows that a divergence on MACD made the asset complete its correctional uptrend at 61.8% fibo and start a new descending movement, which, after breaking 38.2% fibo, is now approaching 50.0% fibo at 64.00. Later, the market may continue falling towards 61.8% and 76.0% fibo at 63.17 and 62.17 respectively. The key downside target is the local low at 60.46.


Dow Jones
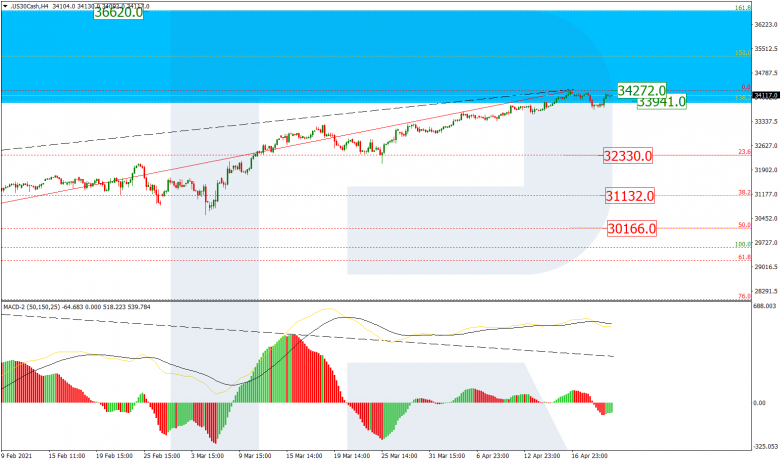
The H4 chart shows that the Dow Jones continues forming a stable ascending tendency to reach the post-correctional extension area between 138.2% and 161.8% fibo at 33941.0 and 36620.0 respectively. However, despite this stable uptrend, the price is slowing down and there is a divergence on MACD, which may indicate a possible pullback soon. The mid-term correctional targets may be 23.6%, 38.2%, and 50.0% fibo at 32330.0, 31132.0, and 30166.0 respectively. The resistance is the high at 34272.0.


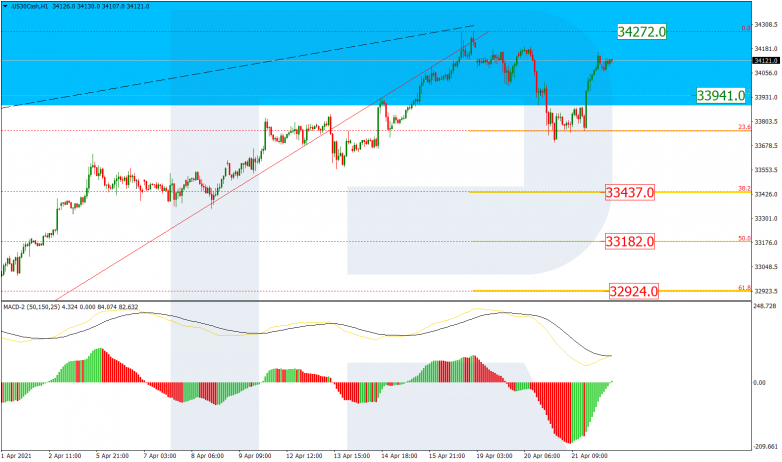
As we can see in the H1 chart, after finishing the descending correctional movement at 23.6% fibo and rebounding from it, the asset is trading towards the high. If the asset fails to break it, the instrument may resume falling to reach 38.2%, 50.0%, and 61.8% fibo at 33437.0, 33182.0, and 32924.0 respectively.


