EURUSD, “Euro vs US Dollar”
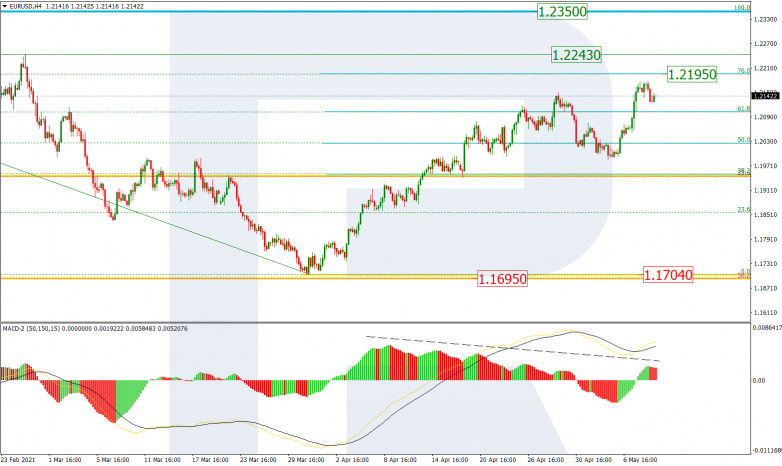
The H4 chart shows that after completing the short-term pullback, EURUSD continues trading upwards; the pair has already broken the local high and is now approaching 76.0% fibo at 1.2195. One should also note that on its way to the high (1.2350) the asset may slow down a bit close to the fractal (1.2243) but this pause will be nothing but a slight correction. However, taken together with a divergence on MACD, this factor may hint at a reversal or a deep correction. The support is the low at 1.1704.

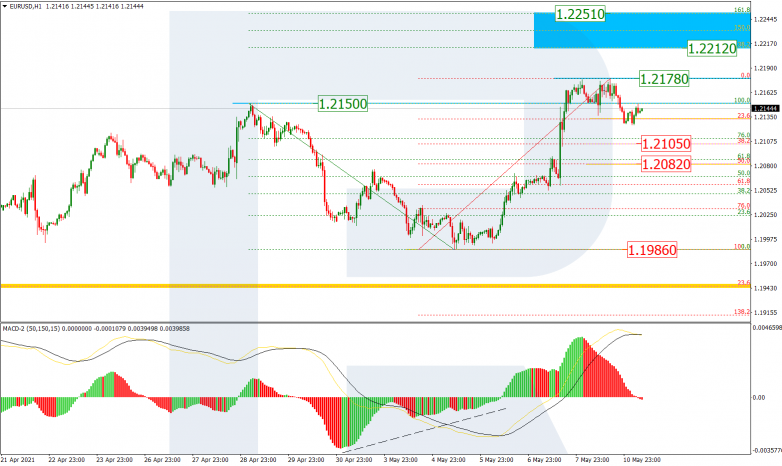
As we can see in the H1 chart, after breaking the high at 1.2150, EURUSD started a new correction, which has already reached 23.6% fibo and may later continue towards 38.2% and 50.0% fibo at 1.2105 and 1.2082 respectively. After that, the instrument may resume growing to break the local high at 1.2178 and then reach the post-correctional extension area between 138.2% and 161.8% fibo at 1.2212 and 1.2251 respectively. The local support is the low at 1.1986.

USDJPY, “US Dollar vs. Japanese Yen”
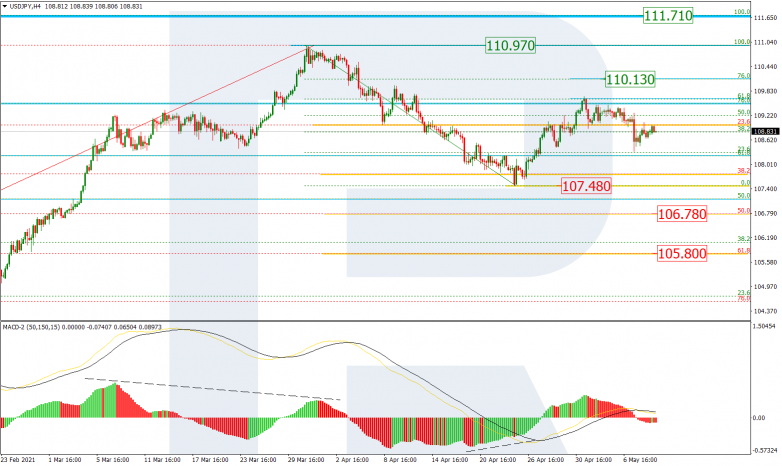
The current situation in the H4 chart is rather uncertain and may indicate both a slowdown in the uptrend and the start of a new mid-term descending wave. The first thing one should note is that after growing and testing 61.8% fibo, the pair started falling towards the local low 107.48. This technical picture makes the “bearish” scenario prevailing. In this case, the downside targets may be 50.0% and 61.8% fibo at 106.78 and 105.80 respectively. At the same time, one shouldn’t exclude an alternative scenario that implies a further uptrend to reach 76.0% and the high at 110.13 and 110.97 respectively.

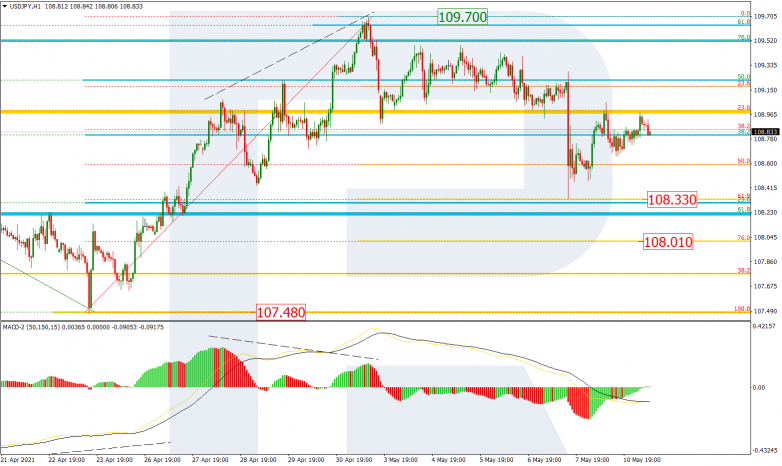
The H1 chart shows that after falling and testing 61.8% fibo at 108.33 a divergence on MACD, USDJPY has returned to 38.2% fibo but may later start a new decline to reach 76.0% fibo and the low at 108.01 and 107.48 respectively. the key support is the above-mentioned low, while the resistance is the high at 109.70.