GBPUSD, “Great Britain Pound vs US Dollar”
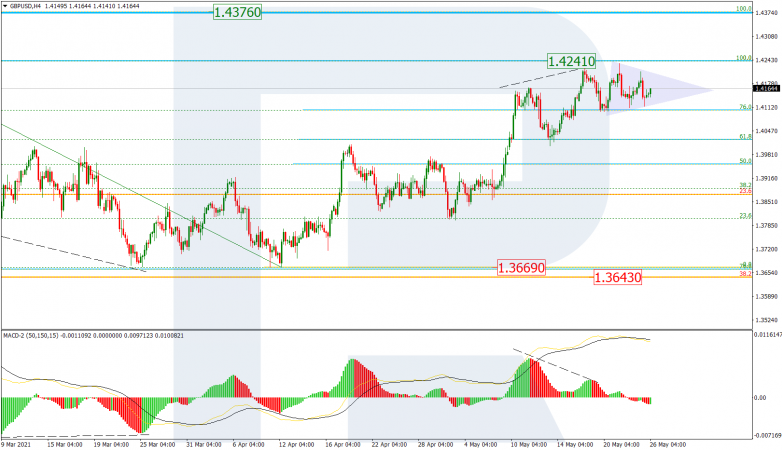
As we can see in the H4 chart, the pair is consolidating between the high (1.4241) and 76.0% fibo after a divergence on MACD. In this case, GBPUSD is expected to break the high and continue growing towards the long-term high at 1.4376. An alternative scenario implies that the price may rebound from the high and extend the correction to 61.8% fibo, which may act as the local support here.


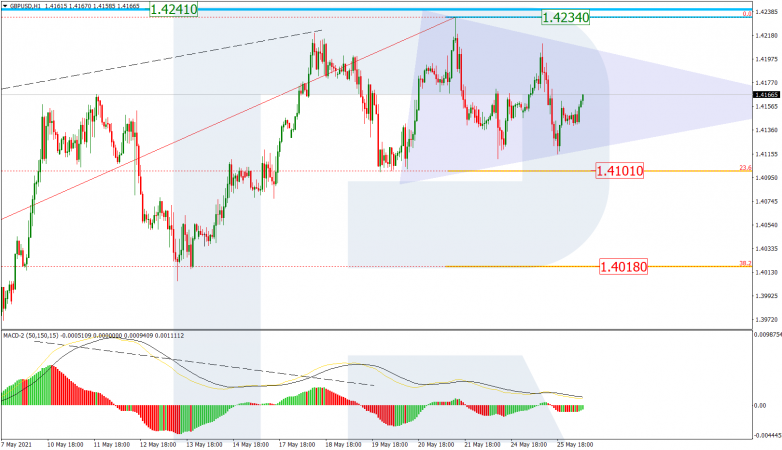
The H1 chart shows a more detailed structure of the current consolidation range after a divergence on MACD. The chart also shows correctional targets, which may be reached after the price breaks the downside border of the above-mentioned range – 23.6% and 38.2% fibo at 1.4101 and 1.4018 respectively. the local resistance is the high at 1.4234.


EURJPY, “Euro vs. Japanese Yen”
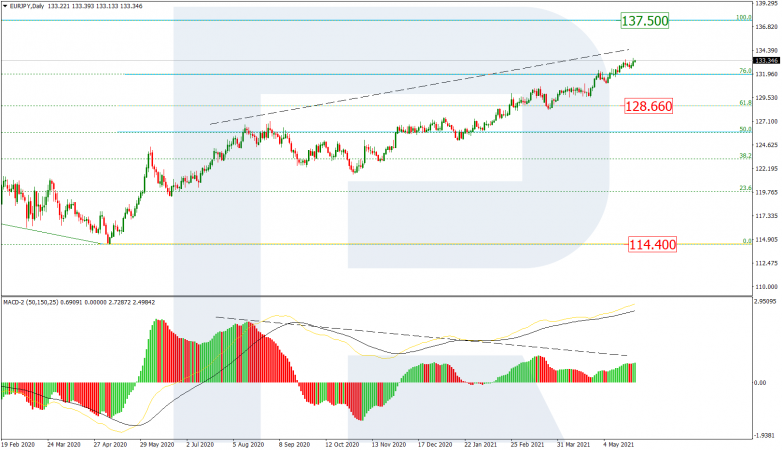
In the daily chart, after breaking 76.0% fibo, EURJPY is still trading upwards to reach its key high at 137.50. At the same time, a divergence on MACD may hint at a possible descending correction after the price reaches its target. The short-term target of this correction may be the support at 61.8% fibo (128.66). If the instrument breaks this level, is may form a new descending impulse towards the low at 114.40.


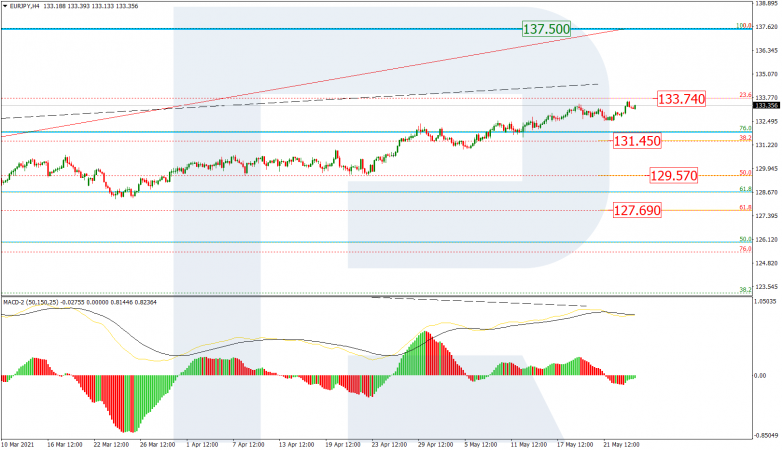
The H4 chart shows possible correctional targets after a divergence on MACD – 23.6%, 38.2%, 50.0%, and 61.8% fibo at 133.74, 131.45, 129.57, and 127.69 respectively.


