AUDUSD, “Australian Dollar vs US Dollar”
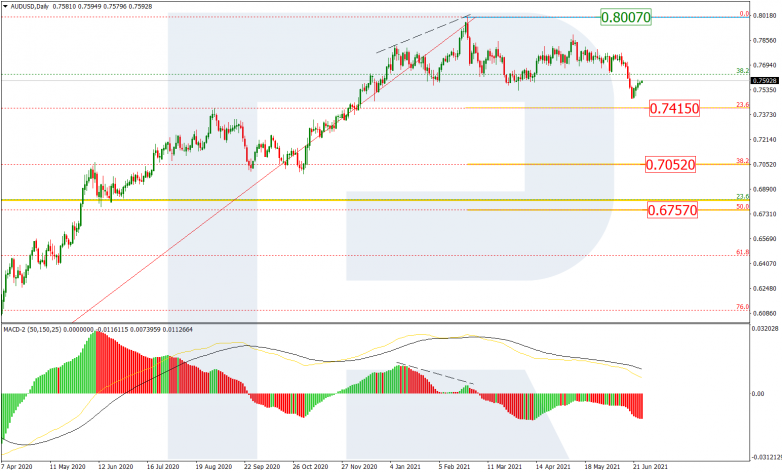
As we can see in the daily chart, there is a new descending correctional wave after a divergence on MACD. After failing to reach 23.6%% fibo at 0.7415, the asset has corrected. The next downside targets may be 38.2% and 50.0% fibo at 0.7052 and 0.6757 respectively. The resistance is the high at 0.8007.

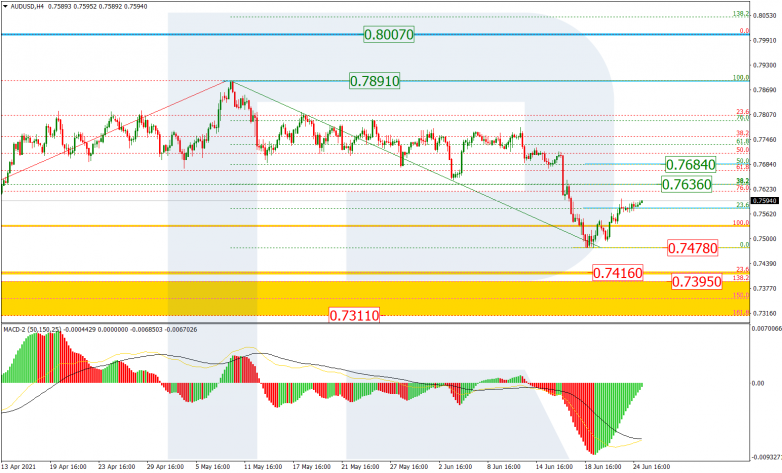
The H4 chart of AUDUSD shows a correctional uptrend after the previous descending wave, which has already reached 23,6% fibo and may later continue towards 38.2% and 50.0% fibo at 0.7636 and 0.7684 respectively. After completing the correction, AUDUSD may resume falling to break the support at 0.7478 and then continue falling towards the post-correctional extension area between 138.2% and 161.8% fibo at 0.7395 and 0.7311 respectively. The local resistance is at 0.7891.

USDCAD, “US Dollar vs Canadian Dollar”
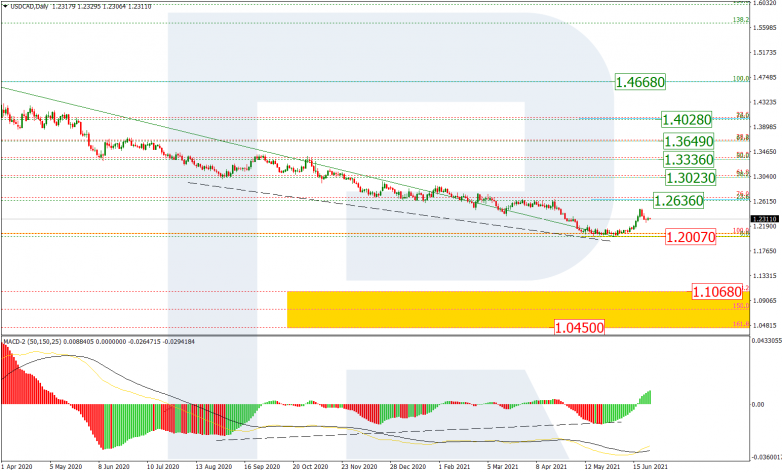
As we can see in the daily chart, USDCAD is moving upwards after a convergence on MACD to reach 23.6%, 38.2%, 50.0%, 61.8%, and 76.0% fibo at 1.2636, 1.3023, 1.3336, 1.3649, and 1.4028 respectively. At the same time, there is a possibility that the price may break the low at 1.2007 and then continue falling towards the post-correctional extension area between 138.2% and 161.8% fibo at 1.1068 and 1.0450 respectively.

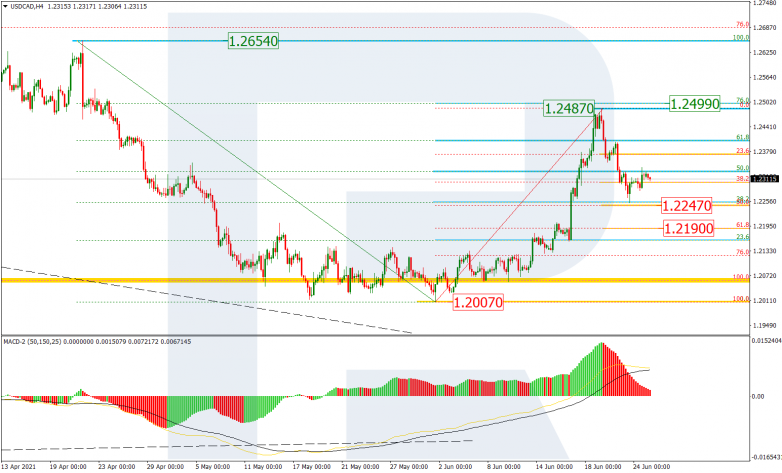
The H4 chart shows a descending correction after the previous ascending impulse. The pair is heading towards 50.0% and 61.8% fibo at 1.2247 and 1.2190 respectively. After the pullback is over, the asset may resume growing to break the high at a.2487 and then reach 76.0% fibo and the fractal at 1.2499 and 1.2654 respectively.