EURUSD, “Euro vs US Dollar”
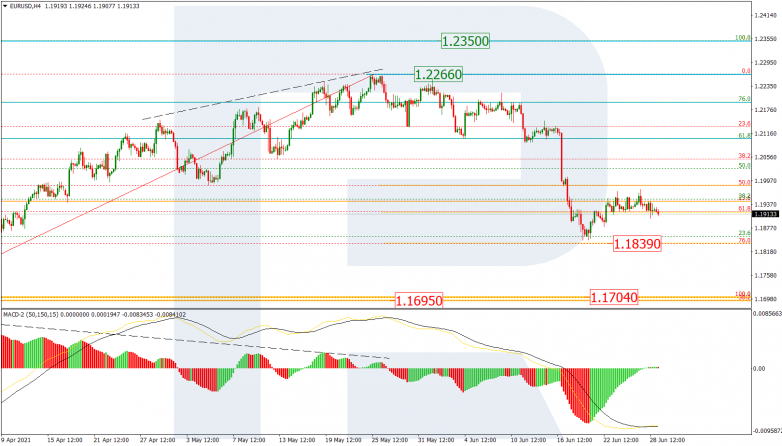
As we can see in the H4 chart, the asset is about to finish the pullback and start a new decline. A divergence on MACD made the pair start a strong wave to the downside, which, after breaking 61.8% fibo, may reach 76.0% fibo and the low at 1.1840 and 1.1704 respectively. After breaking the low, EURUSD may form a new descending wave towards the long-term 50.0% fibo at 1.1695 respectively. The key resistance is the high at 1.2266.

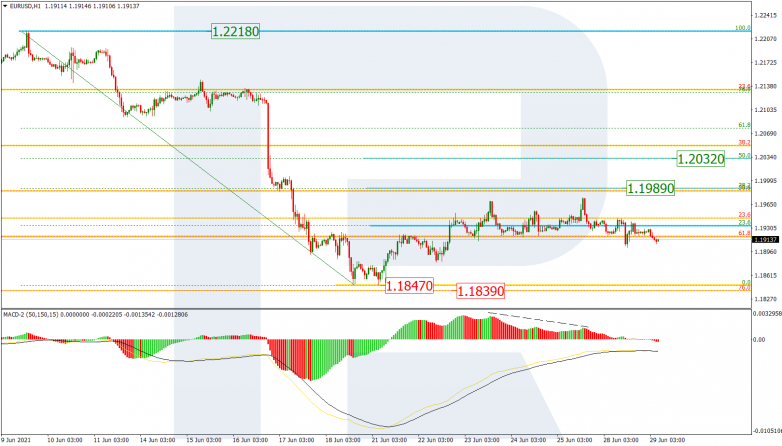
The H1 chart shows a more detailed structure of the current correction, which, after breaking 23.6% fibo, has failed to reach 38.2% fibo at 1.1989. Still, if the price finally breaks the latter level, the next upside correctional target may be 50.0% fibo at 1.2032. However, the main scenario implies a further downtrend towards the low. A breakout of the local support at 1.1847 will complete the pullback and lead to a further decline.

USDJPY, “US Dollar vs. Japanese Yen”
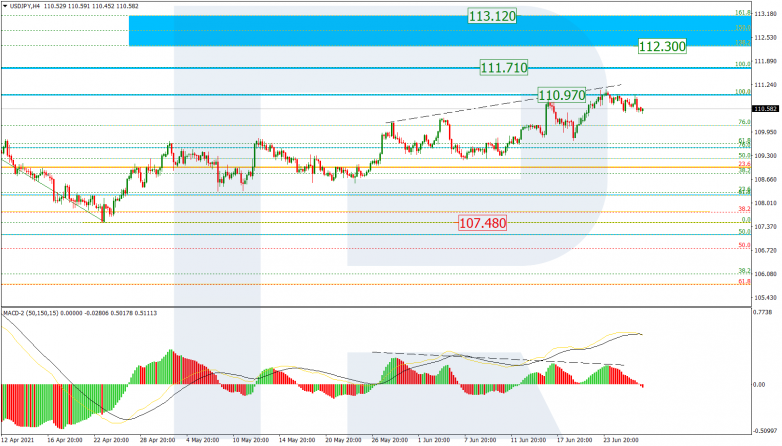
In the H4 chart, a test of the previous high at 110.97 has been followed by a divergence on MACD, which may hint at a possible pullback. However, a breakout of the high may lead to a further uptrend to break the fractal high at 111.7 and then reach the post-correctional extension area between 138.2% and 161.8% fibo at 112.39 and 113.12 respectively. The support is the fractal low at 107.48.

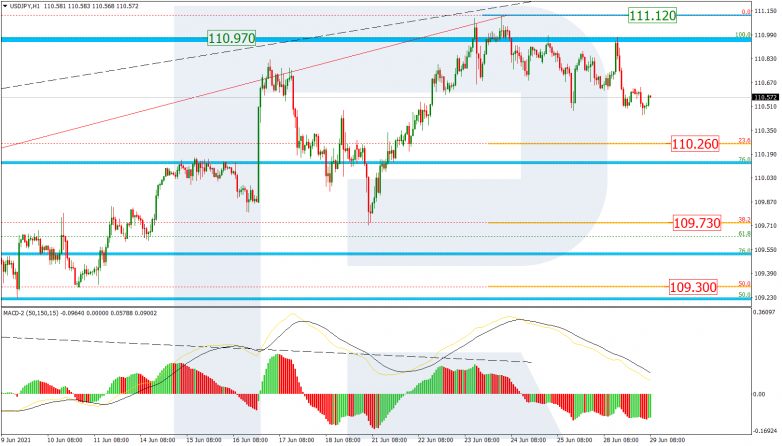
The H1 chart shows a correctional decline after a divergence on MACD towards 23.6% fibo. Possibly, the pair may break this level and form a new descending wave to reach 38.2% and 50.0% fibo at 109.73 and 109.30 respectively. On the other hand, if the asset breaks the high at 111.12, the instrument will finish the correction and continue trading within the uptrend.