AUDUSD, “Australian Dollar vs US Dollar”
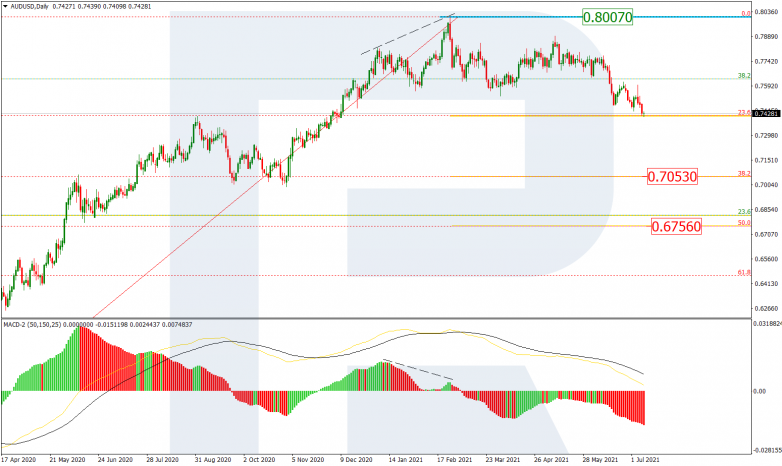
As we can see in the daily chart, there is a steady descending correctional wave after divergence on MACD, which is testing and trying to break 23.6%% fibo at 0.7415. The next downside targets may be 38.2% and 50.0% fibo at 0.7053 and 0.6757 respectively. The resistance is the high at 0.8007.

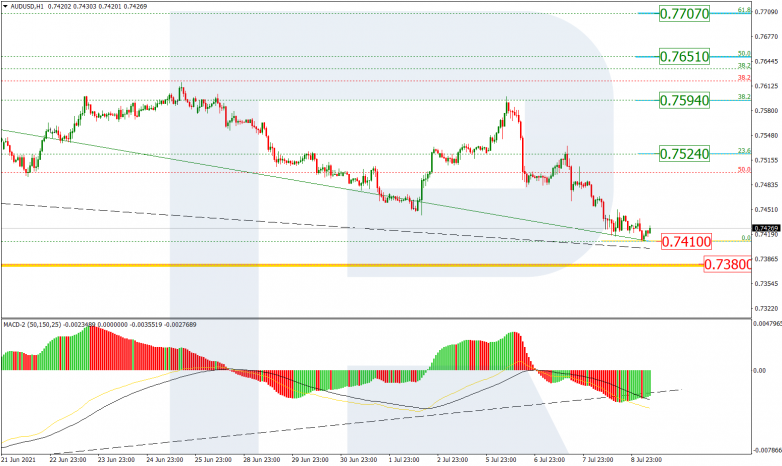
The H1 chart of AUDUSD shows convergence on MACD, which may indicate a possible pullback to the upside towards 23.6%, 38.2%, 50.0%, and 61.8% fibo at 0.7524, 0.7594, 0.7651, and 0.7707 respectively. A breakout of the low at 0.7410 will result in a further downtrend.

USDCAD, “US Dollar vs Canadian Dollar”
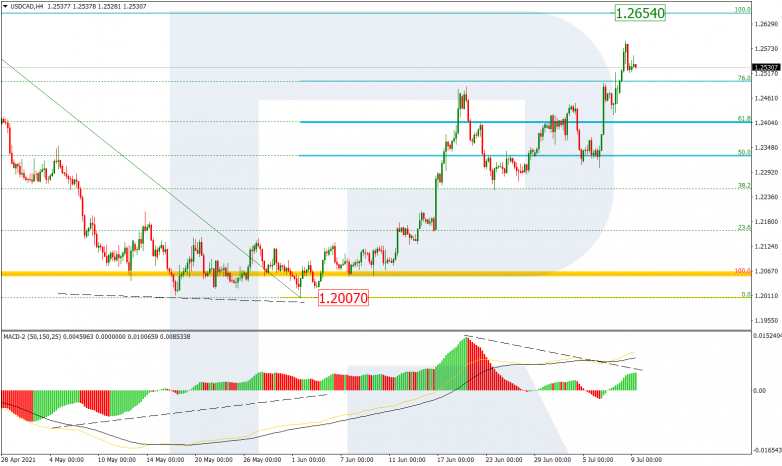
As we can see in the H4 chart, after breaking 76.0% fib, USDCAD is approachi9ng the fractal high at 1.2654. The support remains at the low at 1.2007. At the same time, there is divergence on MACD, which may indicate a new pullback after the asset tests the high.

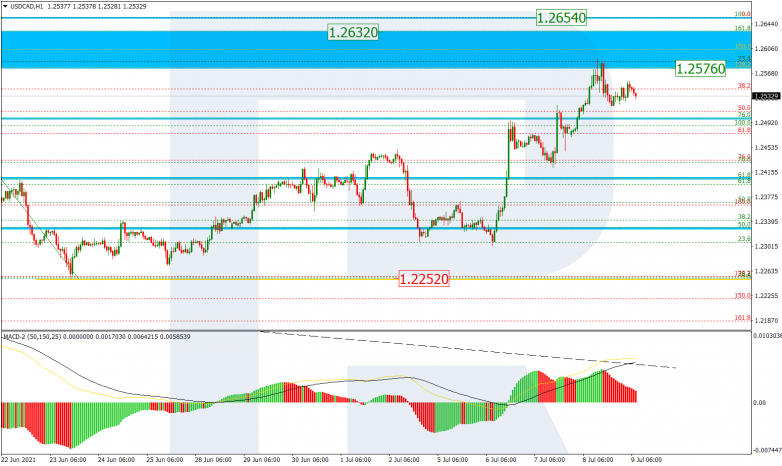
In the H1 chart, the pair is growing towards the post-correctional extension area between 138.2% and 161.8% fibo at 1.2576 and 1.2632 respectively. The local support is at 1.2252.