Brent
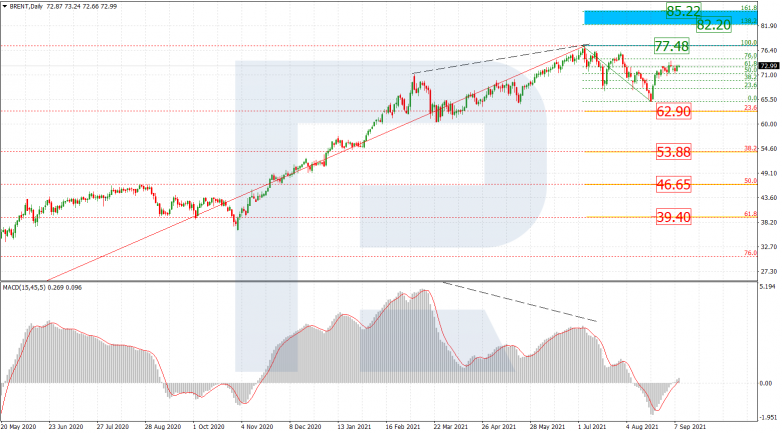
The daily chart is still showing the rising wave towards the high at 77.48. The wave is quite stable but something prevents the asset from growing more actively. If Brent finally breaks the high, it may continue growing towards the post-correctional extension area between 138.2% and 161.8% fibo at 82.20 and 85.22 respectively. However, as long as the price is moving below the high, it may yet start another decline to reach 23.6%, 38.2%, 50.0%, and 61.8% fibo at 62.90, 53.88, 46.65, and 39.40 respectively.


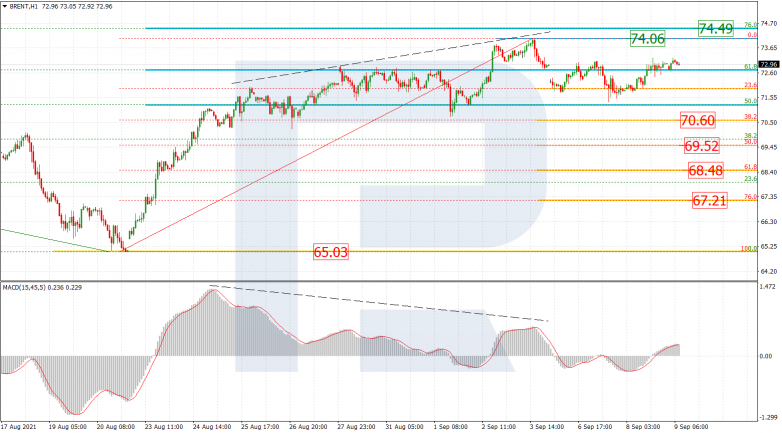
As we can see in the H1 chart, an attempt to reach the mid-term 76.0% fibo at 74.49 was followed by divergence on MACD, which made the asset start a new decline to test 23.6% fibo. The next downside target may be 38.2%, 50.0%, 61.8%, and 76.0% fibo at 70.60, 68.52, 68.48, and 67.21 respectively. However, the key target is the fractal support at 65.03. The local resistance is at 74.06.


Dow Jones
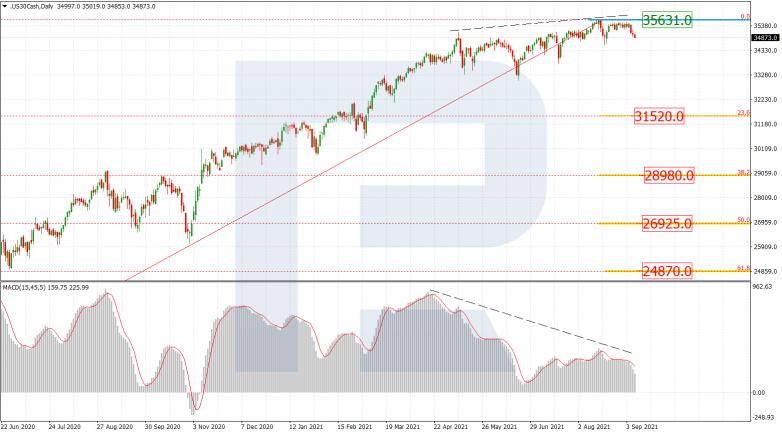
The daily chart shows another signal in favour of the descending tendency after an unsuccessful test of the all-time high at 35631.0. Such a technical situation implies that the instrument may soon start a long-term bearish phase. The possible downside targets may be 23.6%, 38.2%, 50.0%, and 61.8% fibo at 31520.0, 28980.0, 26925.0, and 24870.0 respectively.


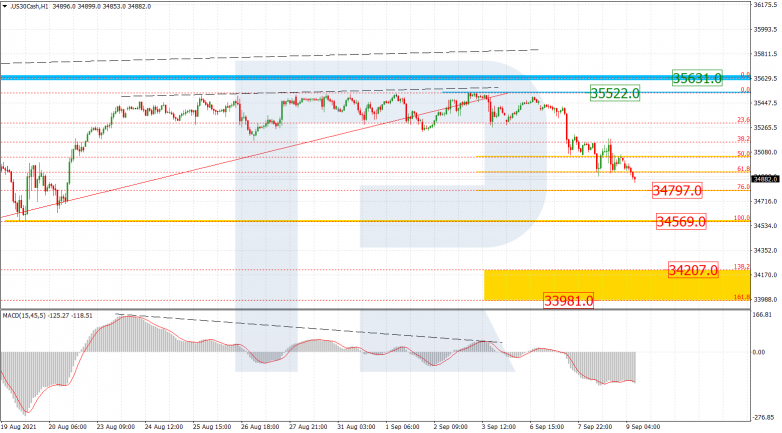
As we can see in the H1 chart, the asset is intending to fall towards 76.0% fibo at 34797.0 after divergence on MACD. The key downside target is the low at 34569.0, a breakout of which may lead to a further downtrend the post-correctional extension area between 138.2% and 161.8% fibo at 34207.0 and 33981.0 respectively. The local resistance is at 35522.0.


