EURUSD, “Euro vs US Dollar”
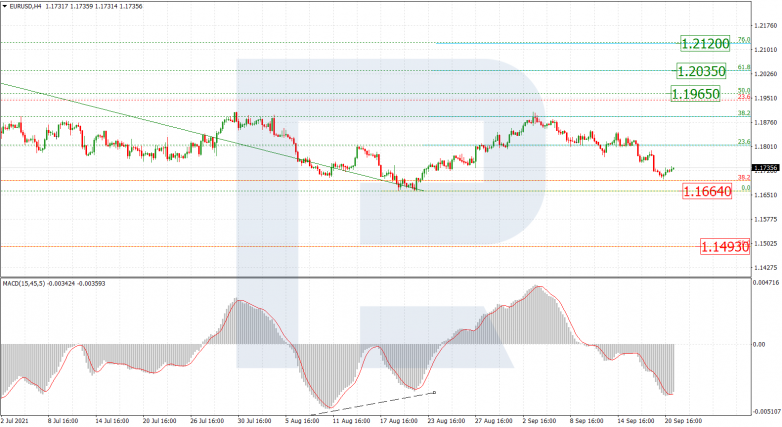
As we can see in the H4 chart, EURUSD is intending to test the previous low at 1.1664; if the price breaks it, the asset may continue moving downwards to reach the long-term 50.0% fibo at 1.1493. However, as long as the price is moving above the low, the pair may yet move upwards and extend the correction. The possible upside targets are 50.0%, 61.8%, and 76.0% fibo at 1.1965, 1.2035, and 1.2120 respectively.


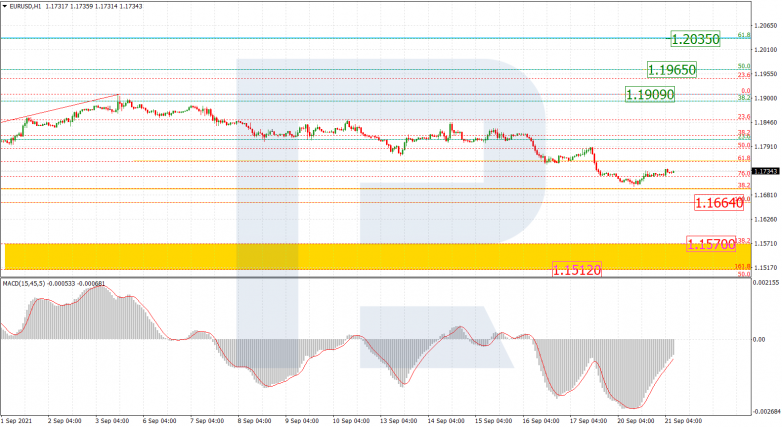
The H1 chart shows the descending correction, which has reached 76.0% fibo. After breaking the low, the asset is expected to continue falling towards the post-correctional extension area between 138.2% and 161.8% fibo at 1.1570 and 1.1512 respectively. The resistance remains at the local high at 1.1909.


USDJPY, “US Dollar vs. Japanese Yen”
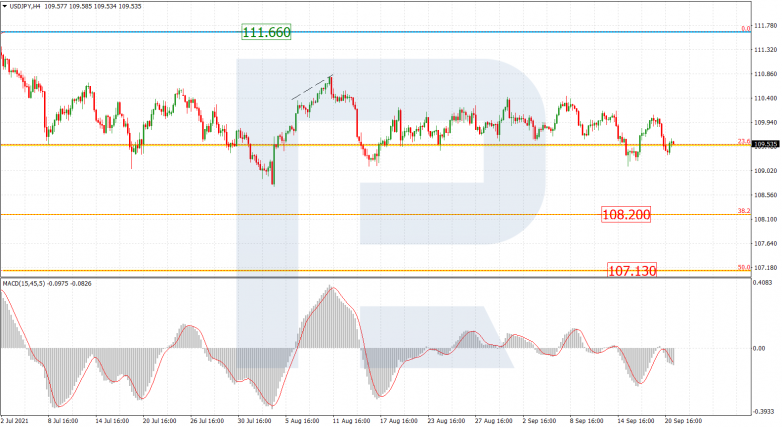
As we can see in the H4 chart, the situation hasn’t changed much. The only difference is that the asset has started testing 23.6% fibo in order to break it to the downside. Overall, the pair continues consolidating. Expectations remain the same – the pair may break this range to the downside and start a new wave to the downside towards 38.2% and 50.0% fibo at 108.20 and 107.13 respectively. The resistance is still the high at 111.66.


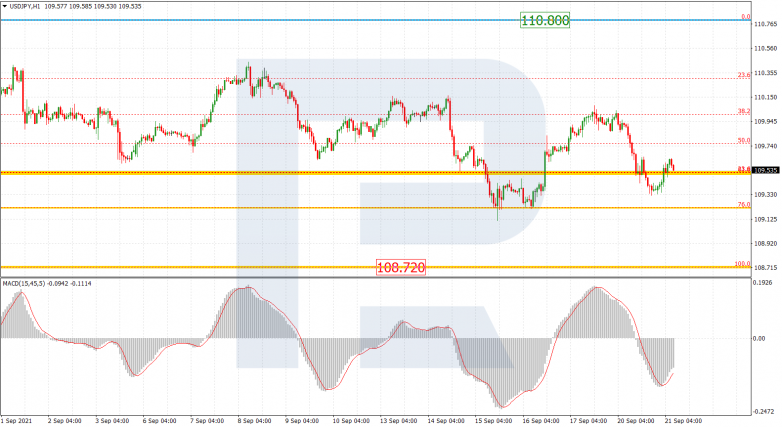
The H1 chart shows that the price is stuck between 110.80 and 108.72. At the moment, the pair may is trying to fall and reach 76.0% fibo again, and that may be a signal in favour of a further decline.


