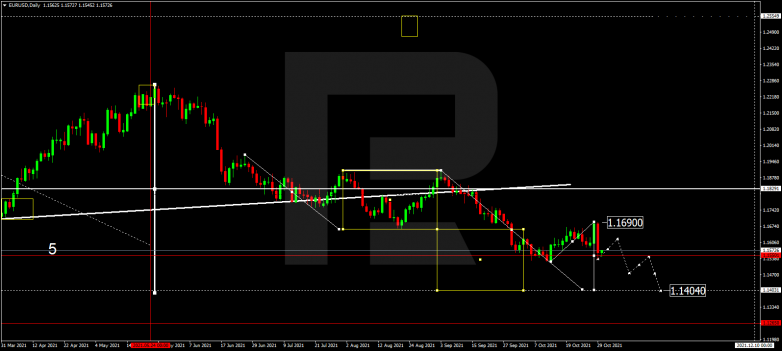
EURUSD, “Euro vs US Dollar”
As we can see in the daily chart, after finishing the correctional wave at 1.1690 and rebounding from this level, EURUSD has completed the first descending impulse. Possibly, the pair may correct to test 1.1625 from below. Later, the market may resume falling to break 1.1535 and then continue trading downwards with the short-term target at 1.1475. Overall, in November the asset is expected to form another descending wave with the key target at 1.1404.

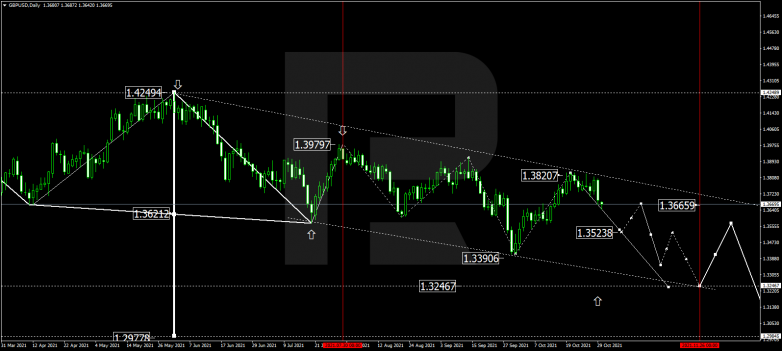
GBPUSD, “Great Britain Pound vs US Dollar”
In the daily chart, after rebounding from 1.3820 to the downside, GBPUSD continues forming the descending wave towards 1.3525 and may later correct to test 1.3666 from below. After that, the instrument may start another with the short-term target at 1.3350. in general, the asset is expected to form a new descending wave to reach 1.3246.

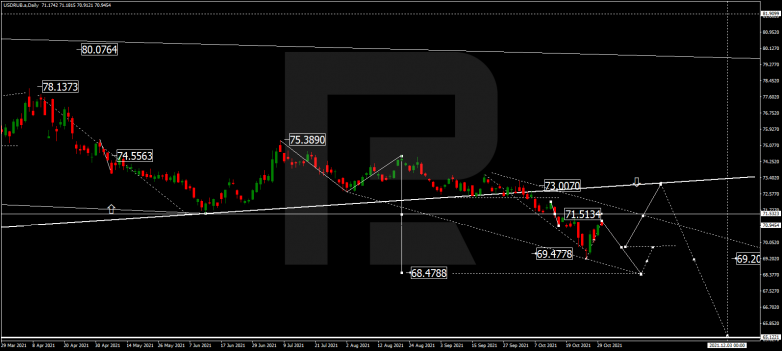
USDRUB, “US Dollar vs Russian Ruble”
As we can see in the daily chart, after breaking the downside border of a Triangle pattern at 72.50, USDRUB has completed the descending structure at 69.56. This month, the asset may grow to test 72.50 from below and then resume trading within the downtrend with the target at 64.05.

USDJPY, “US Dollar vs Japanese Yen”
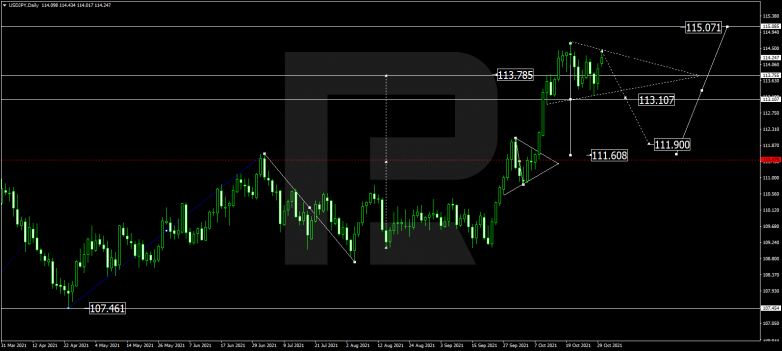
In the daily chart, USDJPY is still consolidating around 113.80. if later the price breaks this range to the upside, the market may start a new growth with the target at 115.07; if to the downside – correct towards 111.60 and then resume trading upwards to reach the above-mentioned target.

BRENT
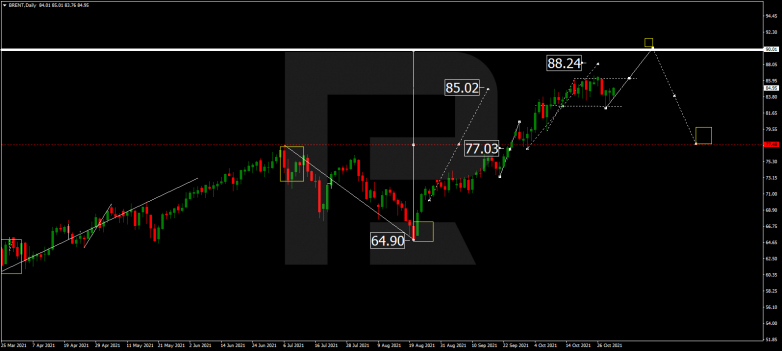
As we can see in the daily chart, Brent is still trading upwards with the target at 90.00. After rebounding from 82.50, the asset continues growing to break 86.00 and may later reach the above-mentioned target. On the other hand, an alternative scenario implies that the price may break 82.00 and continue the correction down to 80.00.

XAUUSD, “Gold vs US Dollar”
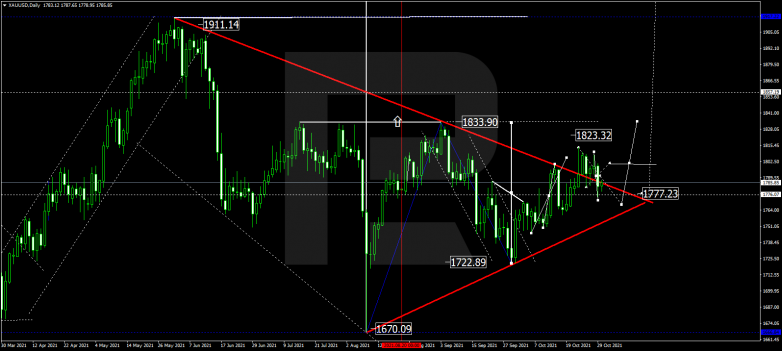
In the daily chart, after finishing the correctional wave at 1777.22, Gold is growing towards 1800.00. Possibly, the metal may choose an alternative scenario and form one more correctional structure to reach 1768.00. However, the main scenario suggests that the pair may grow to break 1833.90 and then continue trading upwards with the key target at 2000.00.

S&P 500
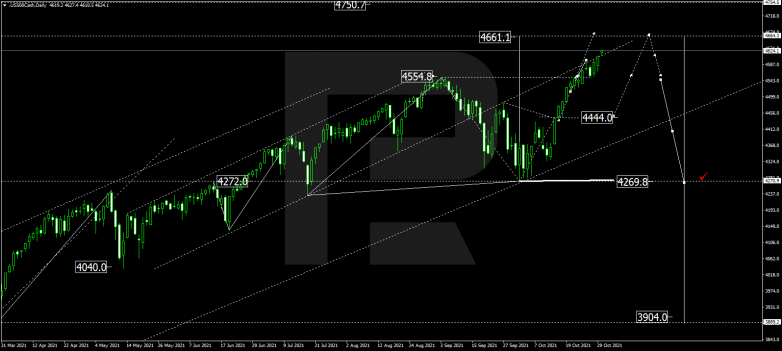
In the daily chart, after forming the consolidation range around 4554.8 and breaking it to the upside, the S&P index continues growing towards 4661.1. Later, the market may return to test 4555.0 from above and then resume trading upwards with the target at 4700.0.
