Here is a detailed daily technical analysis and forecast for EURUSD, USDJPY, GBPUSD, AUDUSD, USDCAD, XAUUSD and Brent for 17 June 2025.
EURUSD forecast
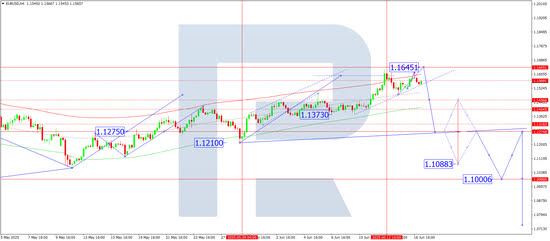
On the H4 chart, EURUSD is forming a consolidation range at the top of the growth wave, around 1.1569. Today, 17 June 2025, the range may extend upwards to 1.1645. After reaching this level, the market may decline towards the lower boundary of the range at 1.1535. A breakout below this level could trigger a trend down to 1.1275, the first target.
The Elliott wave structure and the growth matrix with a pivot at 1.1400 technically confirm this scenario, which is key in the current EURUSD wave. The market previously completed a growth wave to the upper boundary of the price Envelope at 1.1630 and is now forming a consolidation range. Today, an upward extension towards 1.1645 is possible, followed by a potential decline to the lower boundary at 1.1456.
Technical indicators for today’s EURUSD forecast suggest growth to 1.1645.
.png)
USDJPY forecast
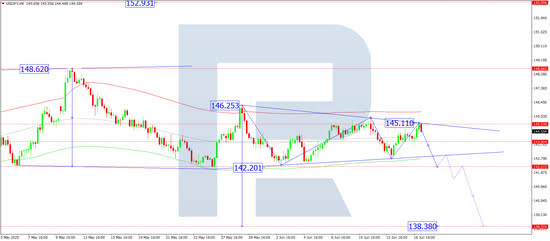
On the H4 chart, USDJPY has developed a wide consolidation range around 143.90, forming a Triangle pattern. The market has completed an upward leg to 145.11. Today, 17 June 2025, a downward wave towards 142.20 is expected. A compact range may form around this level, with a potential breakout to 138.38 — the local target.
The Elliott wave structure and the decline matrix with a pivot at 142.20 confirm this scenario as key in the USDJPY wave. The market is currently consolidating around the central line of the price Envelope at 144.00. Today, a move down towards the lower boundary at 142.20 is likely.
Technical indicators for today’s USDJPY forecast suggest a potential decline to 142.20.
GBPUSD forecast
On the H4 chart, GBPUSD continues to form a consolidation range around 1.3575. Today, 17 June 2025, an extension to 1.3636 is possible. Afterwards, a decline towards the lower boundary at 1.3518 is expected. If this level breaks, the wave could extend to 1.3396, the first target.
The Elliott wave structure and the growth wave matrix with a pivot at 1.3518 confirm this scenario as key in the current wave. The market is forming a range around the central line of the price Envelope at 1.3575. A rise to the upper boundary at 1.3636 is possible, followed by a decline to the lower boundary at 1.3518.
Technical indicators for today’s GBPUSD forecast suggest a rise to 1.3636.

AUDUSD forecast
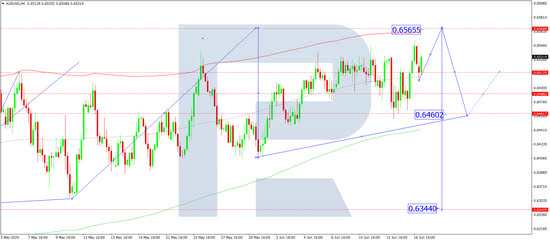
On the H4 chart, AUDUSD found support at 0.6500. Today, 17 June 2025, the forecast expects a rise to 0.6565. Afterwards, a downward wave towards 0.6460 may begin.
The Elliott wave structure and the decline matrix with a pivot at 0.6484 support this scenario, which is key for the AUDUSD wave. The market is forming a wave towards the upper boundary of the price Envelope at 0.6565. After reaching this level, a decline to the central line at 0.6500 is expected.
Technical indicators for today’s AUDUSD forecast suggest a rise to 0.6565.
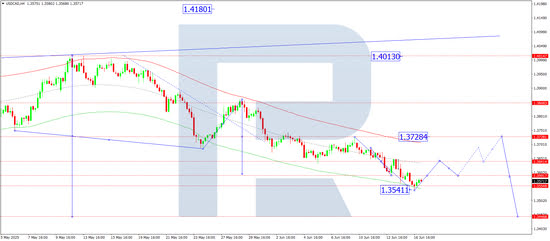
USDCAD forecast
On the H4 chart, USDCAD completed a downward wave to 1.3541. Today, 17 June 2025, the forecast considers a rise to 1.3641 with potential continuation to 1.3730. This movement would serve as a correction to the previous downward wave.
The Elliott wave structure and the decline matrix with a pivot at 1.3728 confirm this outlook as key for the current USDCAD wave. The market has reached the lower boundary of the price Envelope at 1.3541. A new upward wave to the upper boundary at 1.3728 may begin.
Technical indicators for today’s USDCAD forecast suggest a rise to 1.3728.
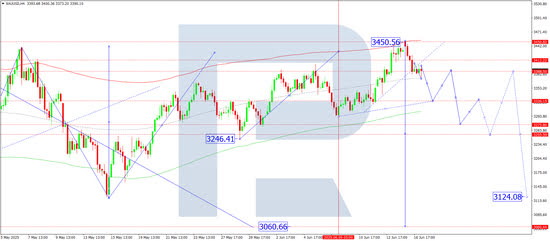
XAUUSD forecast
On the H4 chart, XAUUSD completed a downward wave to 3,373, breaking the fifth wave growth channel and forming a continuation pattern. Today, 17 June 2025, a compact consolidation range has formed around 3,388. If the price breaks upward, a correction to 3,412 is possible. A downward breakout may lead to a continuation of the first wave down to 3,323.
The Elliott wave structure and the decline matrix with a pivot at 3,388 confirm this scenario as key in the current XAUUSD wave. The market has formed a downward wave to the central line of the price Envelope at 3,388. A move down to the lower boundary at 3,323 is likely.
Technical indicators for today’s XAUUSD forecast suggest a continued decline to 3,323.
Brent forecast
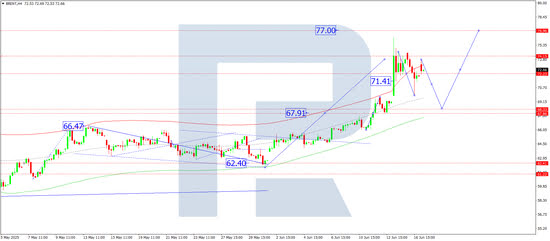
On the H4 chart, Brent crude continues consolidating around 72.22. Today, 17 June 2025, the forecast expects a downward extension to 68.33 as a correction to the previous growth wave. Afterwards, a new upward wave to the local target of 77.00 may begin.
The Elliott wave structure and the growth matrix with a pivot at 67.90 confirm this scenario as key in Brent’s current wave. The market is forming a corrective structure to the central line of the price Envelope at 68.33. Later, a wave to the upper boundary at 77.00 is possible.
Technical indicators for today’s Brent forecast suggest a correction down to 68.33.