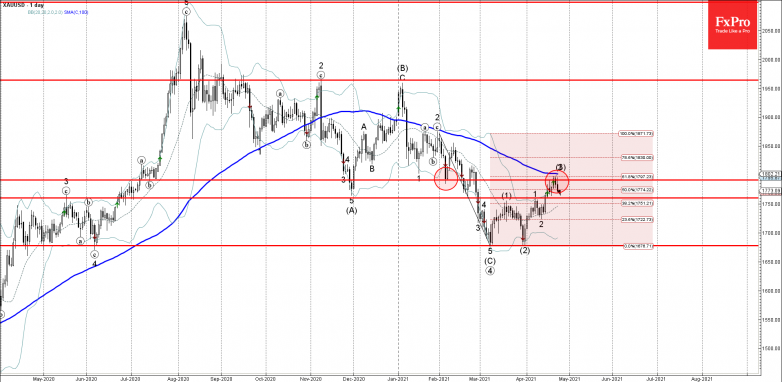
• Gold reversed from resistance level 1790.00
• Likely to fall to support level 1760.00
Gold continues to fall after the price reversed down from the resistance level 1790.00 (former support from the start of February).
The resistance zone near the resistance level 1790.00 was further strengthened by the 100-day moving average upper daily Bollinger Band and the 61.8% Fibonacci corrector of the downward impulse from February.
Gold is likely to fall further toward the next support level 1760.00 (former resistance from the start of January).