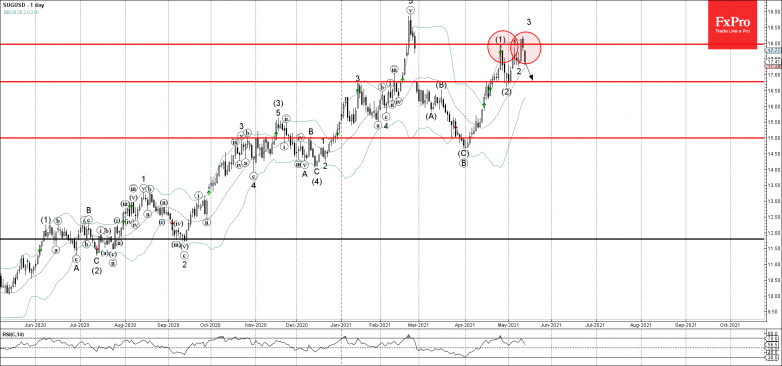
• Sugar reversed from resistance area
• Likely to fall to support level 16.80
Sugar recently reversed down from the resistance area lying between the resistance level 18.00 (top of the impulse wave (1) from April) and the upper daily Bollinger Band.
The downward reversal from this resistance area formed the daily Japanese candlesticks reversal pattern Dark Cloud Cover.
Given the bearish divergence on the daily RSI indicator – Sugar is likely to fall further toward the next support level 16.80.