• NZDCAD reversed from support zone
• Likely to rise to resistance level 0.8720
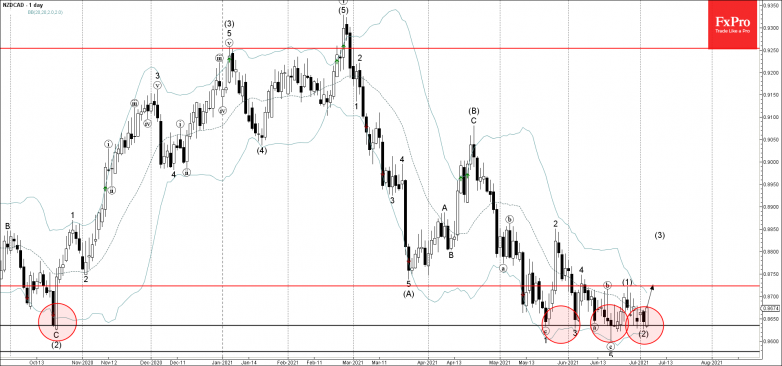
NZDCAD currency pair recently reversed up from the support zone located between the key support level 0.8635 (which has been reversing the price from last October) and the lower daily Bollinger Band.
The upward reversal from this support zone stopped the previous intermediate ABC correction (2).
NZDCAD can be expected to rise further toward the next resistance level 0.8720 (top of the previous wave (1) from the end of June).