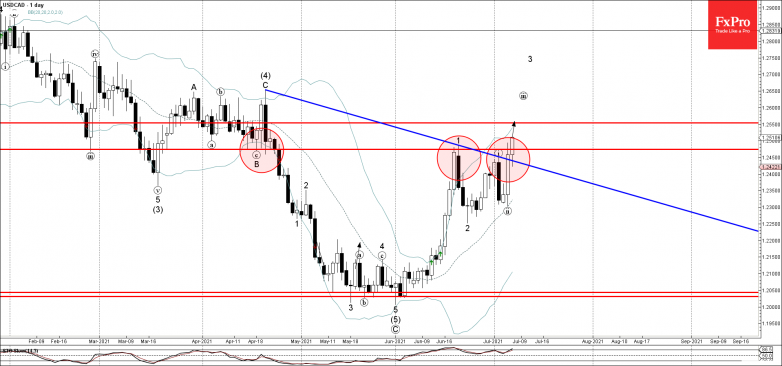
• USDCAD broke resistance zone
• Likely to rise to resistance level 1.2550
USDCAD recently broke the resistance zone located between the key resistance level 1.2475 and the resistance trendline of the daily resistance trendline from April.
The breakout of this resistance zone accelerated the active short-term impulse waves (iii) and 3 – belonging to wave (1) from May.
Given the strong outflows from the Canadian dollar or oil prices falling sharply, USDCAD can be expected to rise further toward the next resistance level 1.2550.