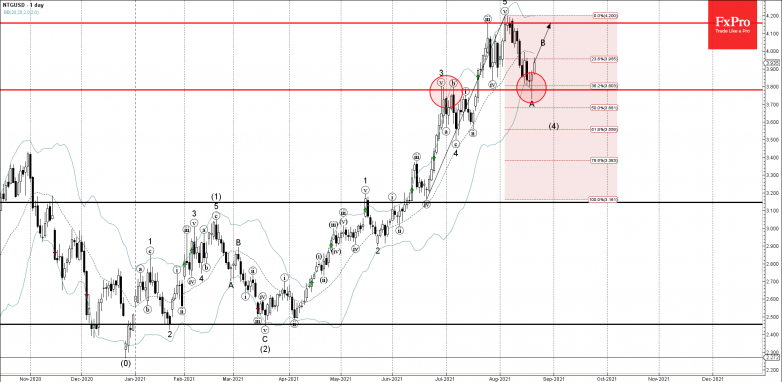
• Natural gas reversed from support zone
• Likely to rise to resistance level 4.160
Natural gas recently reversed up from the support zone located between the support level 3.800 (former resistance from June and July), lower daily Bollinger Band and the 38.2% Fibonacci correction of the upward impusle from June.
The upward reversal from this support zone created the daily Hammer, which started the active short-term impulse wave B.
Natural gas can be expected to rise further toward the next resistance level 4.160 (which has been reversing the price from the end of July).