• Verizon reversed from resistance zone
• Likely to fall to support level 51.00
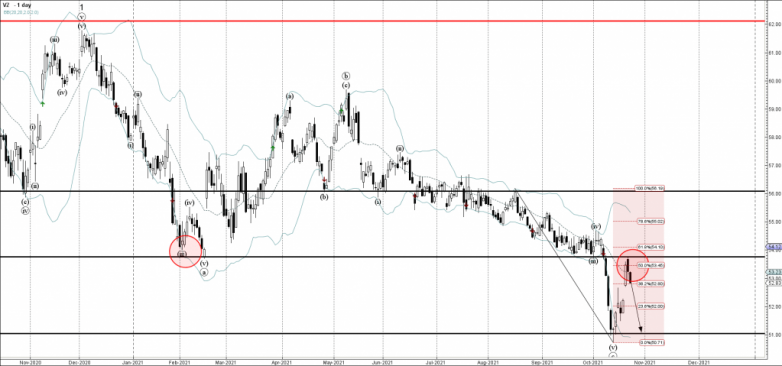
Verizon recently reversed down from the resistance zone lying between the pivotal resistance level 53.75 (former multi-month support from February) and the 50% Fibonacci correction of the downward impulse from August.
The downward reversal from this resistance zone continues the clear multi-month downtrend that can be seen on the daily Verizon charts.
Verizon can be expected to fall further toward the next support level 51.00 (low of the previous morning star form the start of October).