• NZDCAD reversed from resistance zone
• Likely to fall to support level 0.8350
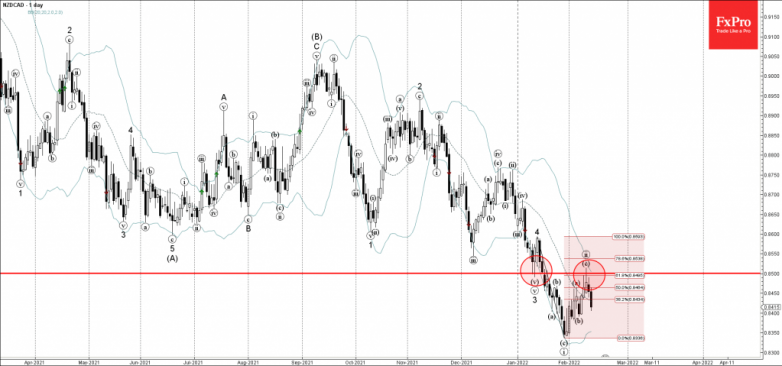
NZDCAD currency pair recently reversed down from the resistance zone located between the resistance level 0.8500 (former support from the start of January), upper daily Bollinger Band and the 61.8% Fibonacci correction of the downward impulse from December.
The downward reversal from this resistance zone stopped the previous short-term ABC correction (ii).
Given the clear daily downtrend- NZDCAD can be expected to fall further toward the next support level 0.8350 (low of the previous impulse wave (i)).