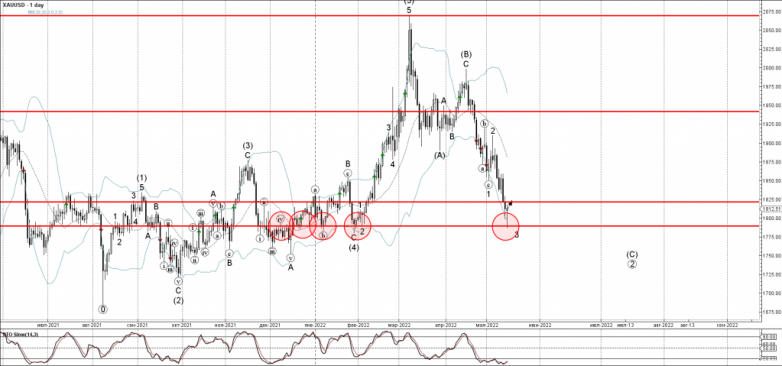
• Gold reversed from support zone
• Likely to rise to resistance level 1825.00
Gold today reversed up from the support zone located between the key support at 1790.00 (which has been reversing the price from December) and the lower daily Bollinger Band.
The upward reversal from the support zone is currently forming the daily Hammer candlesticks reversal pattern.
Given the strongly oversold daily Stochastic – Gold can be expected to rise further toward the next resistance level 1825.00.