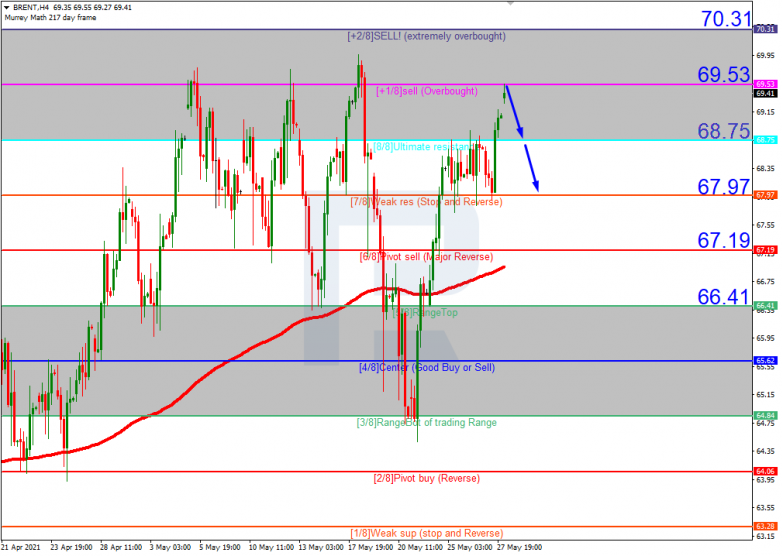
In the H4 chart, Brent is moving within the “overbought area”. In this case, the pair is expected to rebound from 1/8 and resume falling towards the support at 7/8. However, this scenario may no longer be valid if the price breaks 1/8 to the upside. After that, the instrument may reverse upwards and reach the resistance at 2/8.

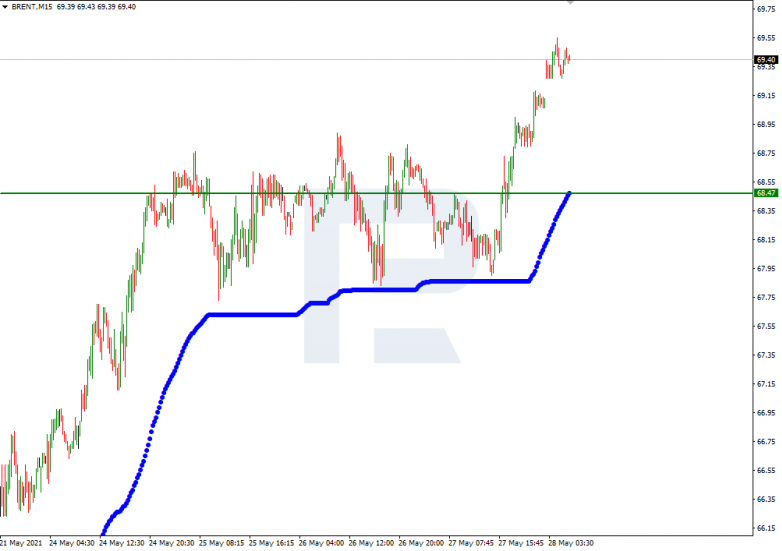
As we can see in the M15 chart, the downside line of the VoltyChannel indicator is pretty far away from the price, that’s why the pair may resume the descending tendency only after rebounding from 1/8 from the H4 chart.

S&P 500
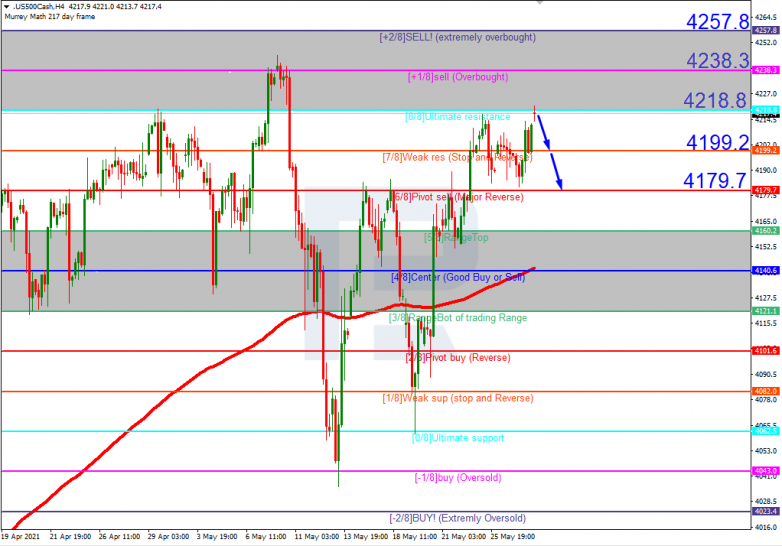
In the H4 chart, the S&P Index is also trading within the “overbought area” close to 8/8. In this case, the price is expected to rebound from this level and resume falling towards the support at 6/8. However, this scenario may no longer be valid if the price breaks 8/8 to the upside. After that, the instrument may move upwards to reach the resistance at 2/8.

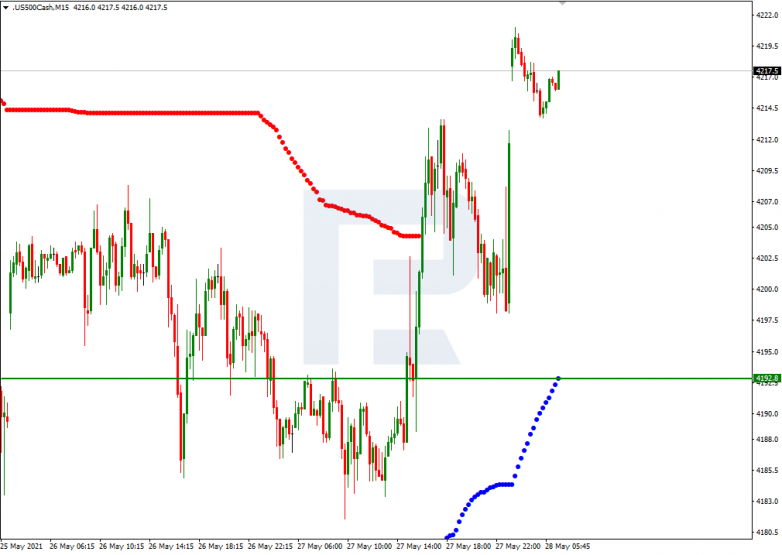
As we can see in the M15 chart, the downside line of the VoltyChannel indicator is pretty far away from the price, that’s why the pair may resume falling only after rebounding from 8/8 from the H4 chart.