Brent
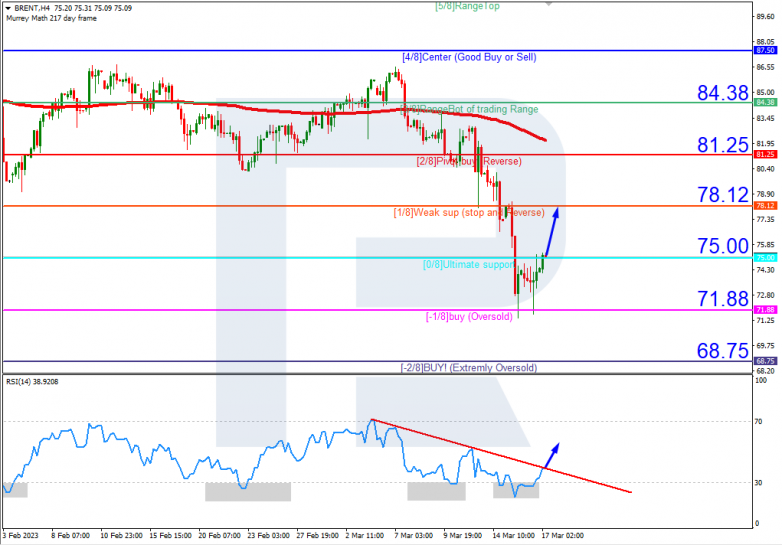
On H4, Brent is in the oversold area. The RSI is testing the resistance line. In this situation we should expect a break-up of the level 0/8 (75.00) and rise to the resistance level 1/8 (78.12). A break-down of the support at -1/8 (71.88) would be a reversal of this scenario. In this case, the oil price will continue falling and might fall to -2/8 (68.75).


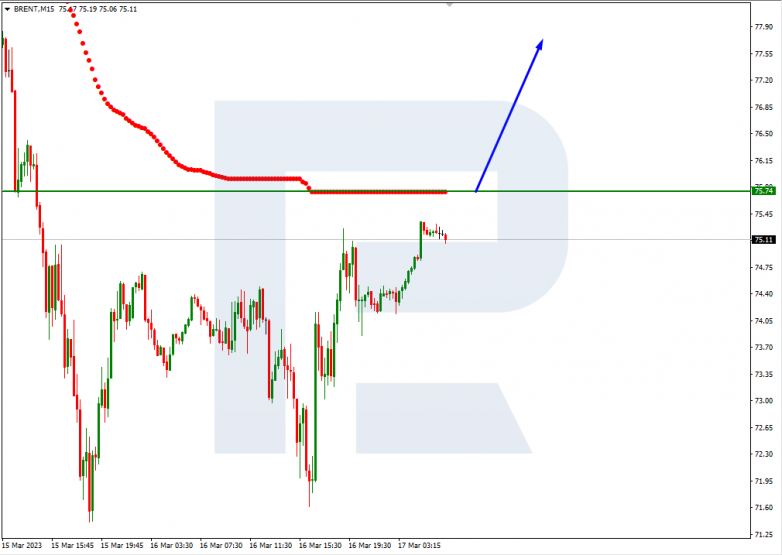
On M15. a break-up of the upper line of the VoltyChannel indicator will be an additional signal for the growth of the price.


S&P 500
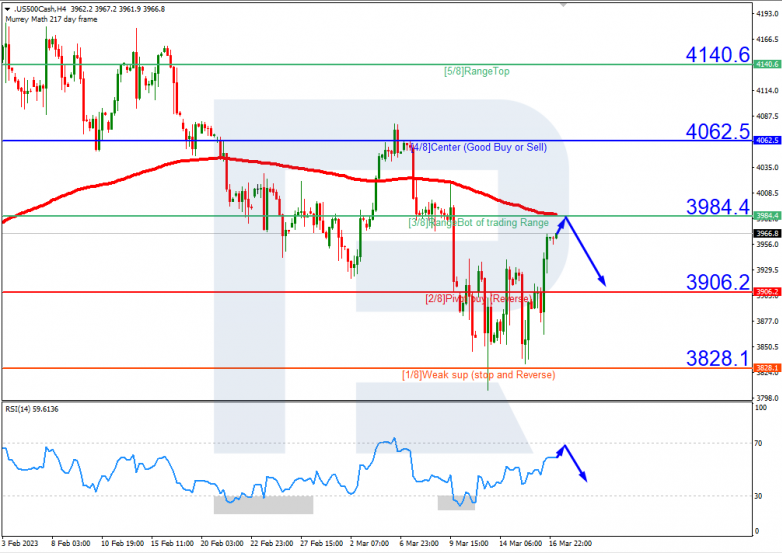
On H4, the S&P 500 index is under the 200-day Moving Average, which indicates that the bearish trend is prevailing. The RSI is approaching the overbought area. As a result, the price is about to test the 3/8 (3984.4) and then rebound to the support level at 2/8 (3906.2). But otherwise, the price might break through the resistance at 3/8 (3984.4), which will lead to the reversal of the trend. That might push the index up to 4/8 (4062.5).


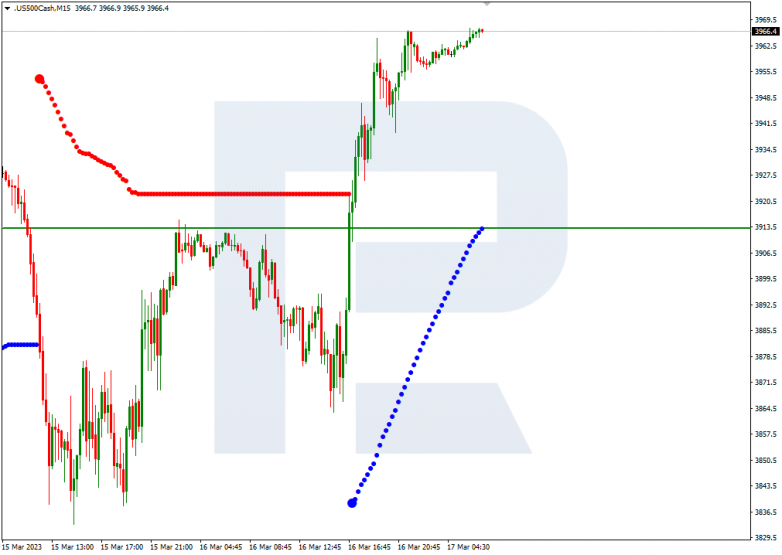
On M15, after the price rebounds from 3/8 (3984.4) in the H4, the breakdown of the bottom line of the VoltyChannel indicator will serve as an additional signal.


Forecasts presented in this section only reflect the author’s private opinion and should not be considered as guidance for trading. RoboForex bears no responsibility for trading results based on trading recommendations described in these analytical reviews.
