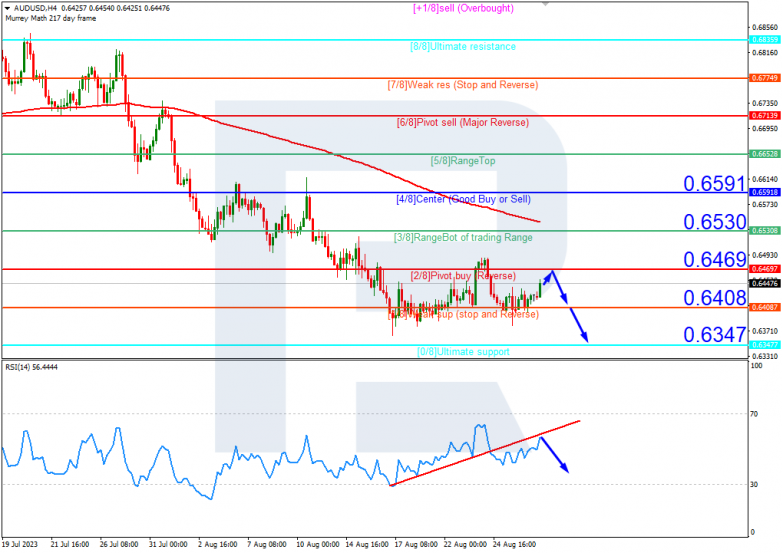
AUDUSD quotes are under the 200-day Moving Average on H4, indicating the prevalence of a downtrend. The RSI is nearing the resistance line. In this situation, a test of 2/8 (0.6469) is expected, followed by a rebound from this level and a decline to the support at 0/8 (0.6347). The scenario can be cancelled by rising above the 2/8 (0.6469) mark. In this case, the quotes could reach the resistance at 3/8 (0.6530).

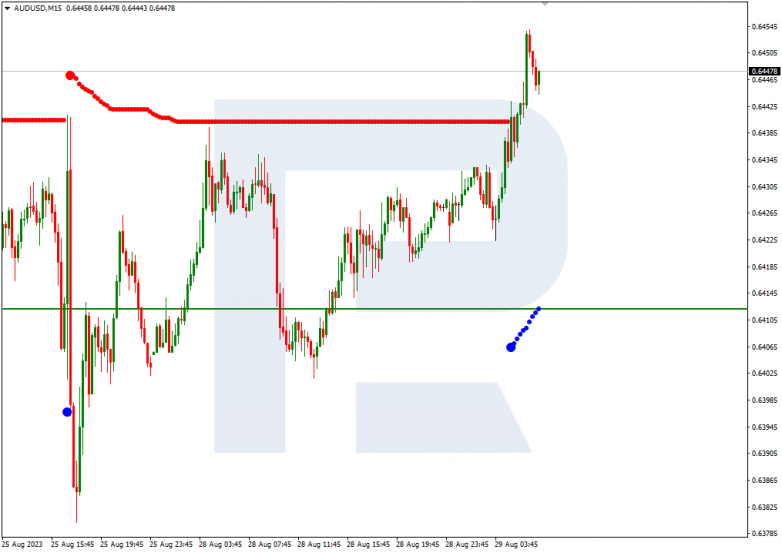
On M15, after a rebound from the 2/8 (0.6469) level, the price decline could be additionally supported by a breakout of the lower boundary of the VoltyChannel.

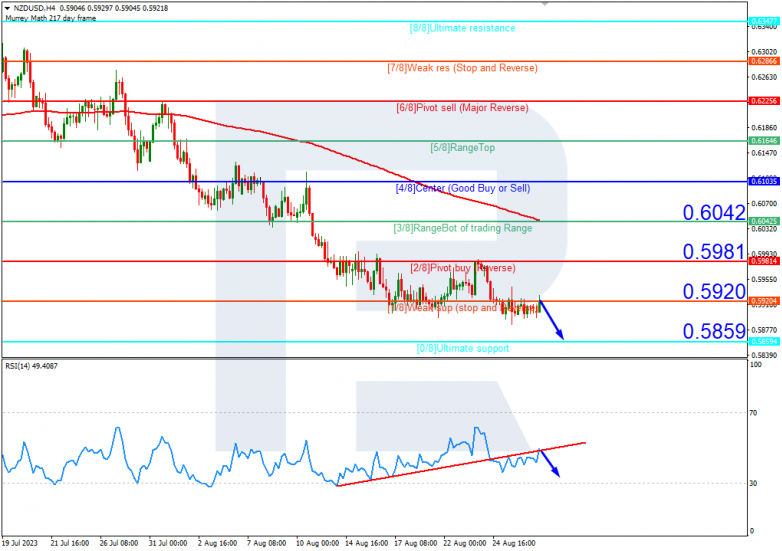
NZDUSD, “New Zealand Dollar vs US Dollar”
On the NZDUSD chart, the situation is similar. The quotes are under the 200-day Moving Average on H4, indicating the prevalence of a downtrend, and the RSI is testing the resistance level. In this situation, a rebound from 1/8 (0.5920) is expected, followed by a decline to the support at 0/8 (0.5859). The scenario can be cancelled by rising above the resistance at 1/8 (0.5920). In this case, the pair could rise to 2/8 (0.5981).

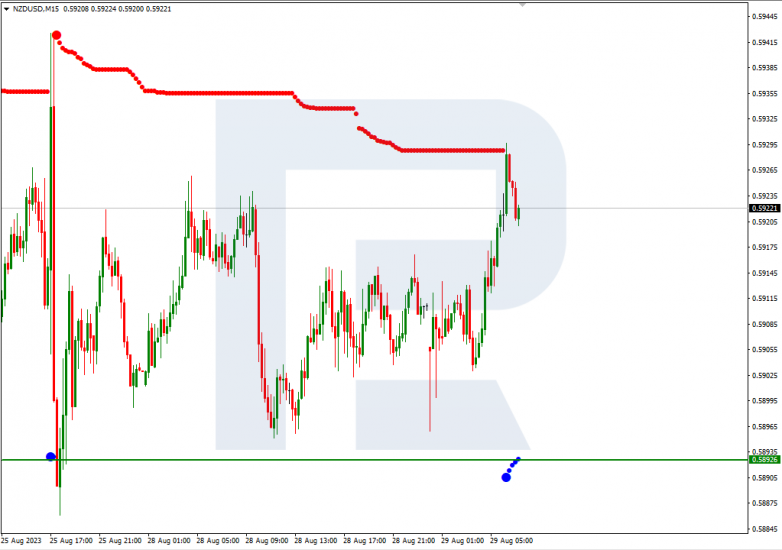
On M15, the lower boundary of the VoltyChannel is too far from the current price, hence, a signal for the price decline could only be a rebound from 1/8 (0.5920) on H4.

Attention!
Forecasts presented in this section only reflect the author’s private opinion and should not be considered as guidance for trading. RoboForex bears no responsibility for trading results based on trading recommendations described in these analytical reviews.