• NZDCAD reversed from resistance area
• Likely to fall to 0.9060
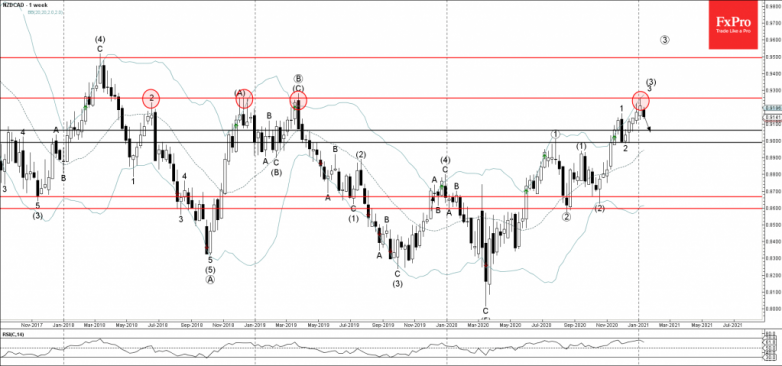
NZDCAD recently reversed down from the powerful resistance area lying between the long-term resistance level 0.9255 (which has been reversing the price from the middle of 2018) and the upper weekly Bollinger Band.
The downward reversal from this resistance area stopped the earlier two weekly upward impulse waves 3 and (3).
Given the strength of the aforementioned resistance area NZDCAD is likely to fall further toward the next support level 0.9060.