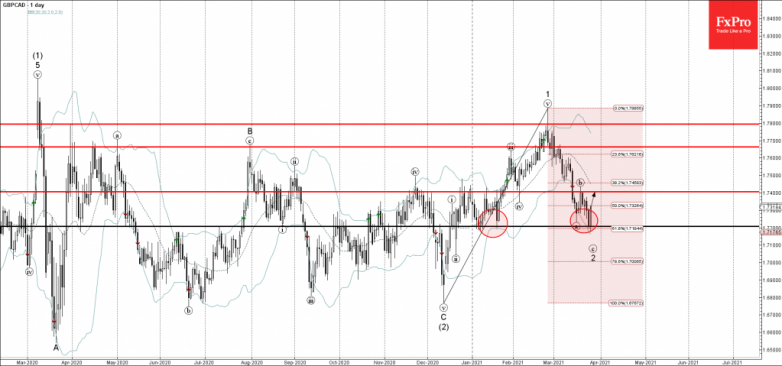
• GBPCAD reversed from support zone
• Likely to reach resistance level 1.7400
GBPCAD recently reversed up from the support zone lying between support level 1.7200 (which has been reversing the price from January) and the lower daily Bollinger Band.
If the pair closes today near the current levels it will form the daily candlesticks reversal pattern Bullish Engulfing.
GBPCAD is likely to rise further toward the next resistance level 1.7400 (top of the previous minor corrective wave (b)).


