A technical indicator is a function based on the values of statistical indicators of trades (prices, trading volume, etc.), the analysis of the behavior of which is designed to answer the question whether the current trend in the market will change or remain.
Based on the analysis of technical indicators, traders, supporters of technical analysis, decide to open (expand) or close (reduce) positions. In this case, technical indicators are usually used in the form of charts, superimposed or combined with charts of prices/volumes of traded instruments.
Besides, technical indicators are to some extent used by mechanical trading systems in algorithmic trading. Technical indicators are named so because they use only statistical indicators of trades (markets) and do not take into account the fundamental indicators of traded instruments.
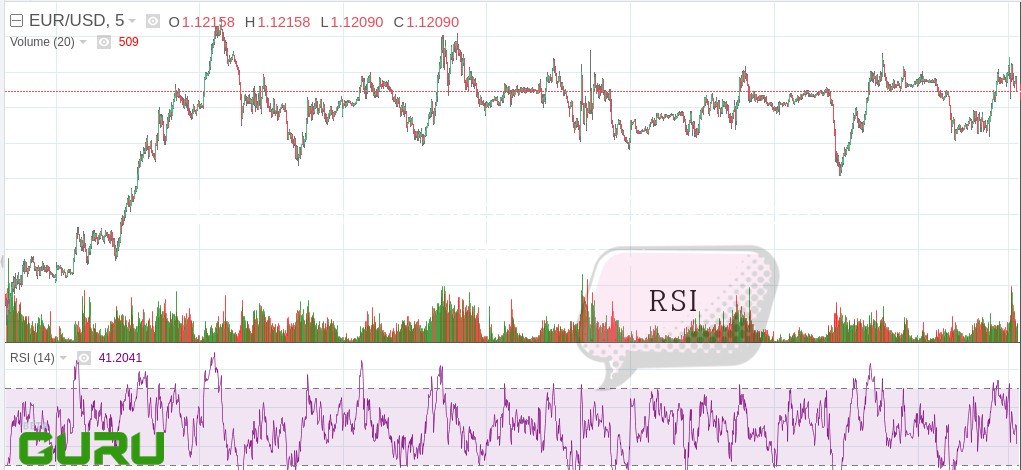
Relative strength index (RSI) is an indicator of technical analysis that determines the strength of the trend and the probability of its change.
The popularity of RSI is due to how easy it is to interpret. The indicator can draw technical analysis figures - "head and shoulders", "top" and others, which are often analyzed along with the price chart. The indicator was developed by W. Wilder and was published in Commodities magazine in June 1978. Wilder advised to use two weeks, today, in addition to this period, traders also use nine-day and 25-day indices.
Signals of the RSI:
- Overbought/oversold - when the RSI value is closer to 100% or 0%, respectively;
- Divergence - when the indicator chart forms extrema in the opposite direction of price movement;
- Technical analysis figures apply to the RSI indicator chart and help predict the end of the trend;
- The trend on the indicator usually coincides with the trend on the price chart up to any of the above events.
Another signal that RSI gives is the divergence. Divergence is considered the strongest signal of technical analysis. If there is a new maximum on the price chart, but a new maximum on the RSI is not formed, it indicates that the trend is over and there will be a price reversal in the opposite direction. With a downward trend on the price, chart formed a new minimum, and RSI did not reach a new minimum, which indicates a weakening of the trend and the subsequent reversal of the price.