The stochastic oscillator is an indicator of technical analysis, which shows the position of the current price relative to the range of prices for a certain period in the past. It is measured in percents.
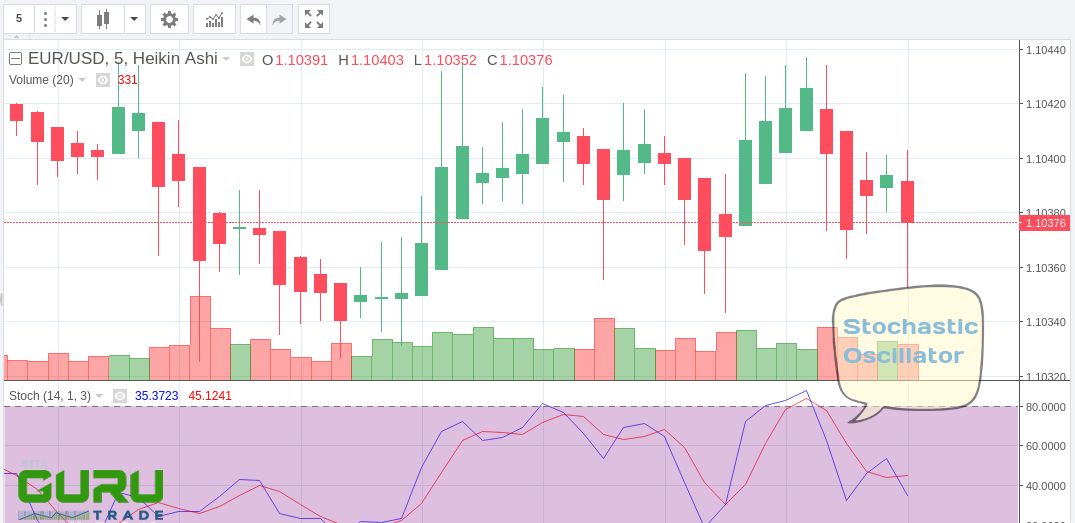
According to the interpretation of the author of the indicator, George Lane, the main idea is that the closing price of the next timeframe tends to stop near the previous maximums. When the price tends to fall (falling trend), the closing price of the next timeframe tends to stop near the previous lows. The indicator shows a difference in the closing price of the current period relative to the prices of previous periods within a given time frame.
The most common interpretations of the chart of the stochastic oscillator:
- Buy when the indicator chart line (%K or %D) first falls below the specified level (usually 20%), and then rises above it. Sell when the indicator chart line rises above a certain level (usually 80%) and then falls below it.
- Buy when the %K line rises above the %D line. Sell if the %K line falls below the %D line. For example, when prices form several new highs, and the stochastic indicator fails to rise above its previous highs, we can expect the beginning of the downward trend of prices, i.e. we can sell.
- Crossing the 80% mark when the indicator is growing is interpreted as a signal of a probable stop of growth or even the beginning of price decline. Crossing the 20% mark when the indicator decreases are interpreted as a signal of a probable stop of the fall or even the beginning of price growth.
The moving average (MA) is a technical indicator based on the analysis of the security quotes behavior and their moving average.
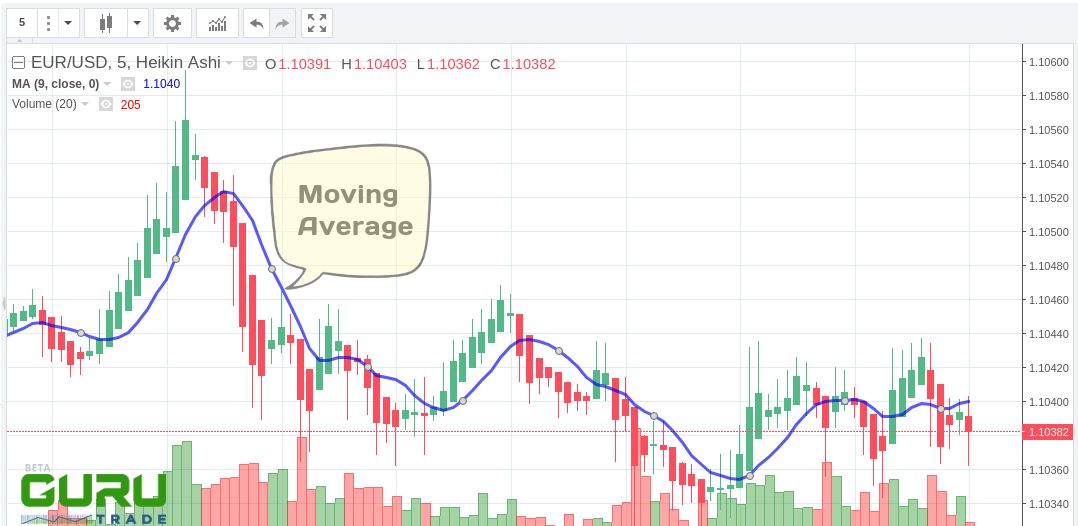
Moving Average is one of the oldest and most common indicators of technical analysis related to trend indicators.
The easiest strategy is to buy the instrument provided that the price chart crosses its moving average from the bottom upwards and sells when the price chart crosses the moving average from the top downwards. Both are called breakdowns. Besides, it is believed that if the price chart line is above the moving average, the market is considered to be "bullish", which can be bought, and if the opposite - "bearish", preferred for sale.
Usually, the indicator gives a lot of false signals to buy/sell. To minimize this phenomenon, several methods are used:
- The decision to buy/sell is made if the distance between the price charts and the moving average after its break-down is equal to a certain number of minimum price changes for the instrument.
- The decision to buy/sell is made if after a break-down of the moving average some time has passed, but the trend has not changed.
- By the percentage envelope method. Instead of one moving average, two lines are built: one higher and the other lower, separated from the calculated moving average by a certain percentage. The decision to buy is made after the chart crosses the price of the upper line from bottom to top and vice versa, the decision to sell is made after the chart crosses the price of the lower line from top to bottom.
- By the band method. Instead of a moving average built at the closing price, two moving averages are built at the maximum and minimum prices. Decisions are made when these lines are crossed by a price chart in the same way as the interest-bearing envelope method.